Updated withdrawal conditions
|
|
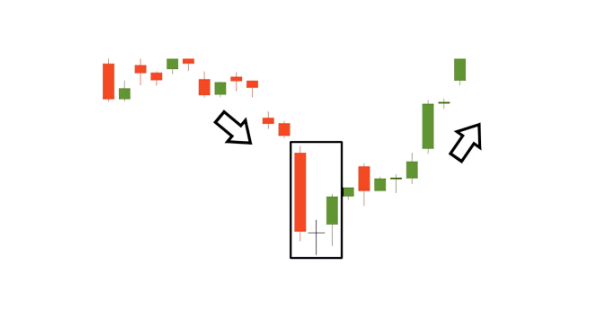
Reversal Candlestick Patterns
Japanese traders have developed numerous candlestick patterns, all of which have withstood the test of time. These patterns are analysed not only by retail traders but also by large financial institutions to forecast market momentum. When a distinct candlestick pattern emerges, traders often heed its signal, which significantly increases the likelihood of the pattern's predicted outcome occurring.

This lesson focuses on the two primary types of candlestick patterns: reversal and continuation, specifically emphasizing the reversal patterns.
Reversal candlestick patterns constitute a set of indicators suggesting a potential shift in trend direction or a significant correction.
So, does it mean that if I hear the term “reversal pattern,” the change of a trend will happen right away?
We might hope for quick changes, but in reality, trends evolve gradually. Reversal candlestick patterns suggest that the prevailing trend may shift, though not necessarily reverse completely.
Two factors increase the strength of a signal given by a reversal pattern:

The preceding trend is strong and steep;
The reversal pattern appears near a strong resistance or support level.
Bullish patterns
We will start with bullish patterns that indicate the price reversal to the upside. They appear at the end of downtrends.
Hammer
Main characteristics:
1. The number of candlesticks: 1;
2. Frequency: high;
3. Color: it doesn’t matter, but bullish is better;
4. Key features: short body, short upper shadow, long lower shadow.

For sure, Thor’s favorite reversal pattern is the Hammer. Indeed, it looks like a hammer! The candle has a long lower shadow, which should be at least twice the length of the real body. Hammers show that although bears could pull the price to a new low, they failed to hold it there and lost a battle with buyers by the end of a trading period.
The signals of hammers are more reliable when:
A hammer forms after a long downtrend;
A hammer is followed by a candlestick that closes above the opening price of the hammer.
Inverted hammer
Main characteristics:
1. The number of candlesticks: 2;
2. Frequency: Medium;.
3. Color: The first candle is bearish; the color of the second doesn’t matter;
4. Key features: The first candle is in the downtrend, the second has no lower shadow or a very short one, and a long upper shadow. The real body of the second candle is small.

This pattern is essentially an inverted hammer configuration. Besides the hammer, this formation necessitates a preceding bearish candlestick. The signal is deemed more trustworthy if the subsequent candlestick is bullish. For confirmation, the pattern requires a breakout above the closest resistance zone or a trend line.
Morning star
Main characteristics:
1. Number of candlesticks: 3;
2. Frequency: Medium;
3. Color: The first candle is bearish, the second candle is bullish/bearish, and the third candle is bullish;
4. Key features: The first candle is in a downtrend, the second appears after the gap down, the third candle opens with a gap up, and the third candle closes at least halfway up the body of the first line.

Here's a brief lesson in Astrology: The term "morning star" often refers to the planet Venus, not Mercury. It's visible in the sky just before dawn, heralding the approaching sunrise. Similarly, in financial astrology, the appearance of a morning star pattern can indicate that prices are about to rise.
The initial candlestick in the pattern ought to be bearish, characterized by a large real body. The subsequent candlestick is expected to open with a gap down, beneath the body of the first, and possess a small real body, indicating a weakening of sellers. The color of this candlestick is irrelevant. The final candlestick should bridge the preceding bearish gap, be bullish in nature, and close above the midpoint of the first candlestick's body.
The signals of morning stars are more reliable when:
The pattern appears after a strong downtrend;
The pattern is confirmed by breaking the trendline or the nearest resistance zone.
The presence of a gap between the candlesticks in a morning star pattern is indeed significant. It typically indicates a shift in market momentum and is considered a criterion for recognizing this pattern in technical analysis. However, the necessity of a gap can vary across different markets. For instance, in forex and crypto markets, the second candle may not show a clear gap from the first candlestick, but it is still acceptable as long as it creates a new low and has a small body. In other markets, such as stocks, a gap is more commonly expected and reinforces the change in momentum.
An ideal morning star pattern typically features gaps between its candles. Nonetheless, certain markets may present exceptions to this characteristic, with the opening and closing prices being identical or nearly so. Such patterns are observable in the Forex market and within intraday charts, such as those spanning 5-minute or 15-minute intervals.
Morning doji star
Main characteristics:
1. The number of candlesticks: 3;
2. Frequency: Rare;
3. Color: The first candle is bearish, the second candle is bullish/bearish, and the third candle is bullish;
4. Key features: The pattern is almost the same as the morning star, but the second candlestick is doji.
As you’ve probably guessed from its name, the morning doji star is practically the same as the regular morning star, but the second candlestick is doji. It provides a stronger signal than the average doji star.
Piercing line
Main characteristics:
1. The number of candlesticks: 2;
2. Frequency: Medium;
3. Color: The first candle is bearish, and the second candle is bullish;
4. Key features: the candles appear during the downtrend. The second candle opens below/equal to the prior low. The closing price of the second candle should be above the middle of the previous candle’s body but below the previous open price.
The piercing line is known as one of the classic bullish reversal patterns. The price gaps downwards after the first bearish candlestick, but bulls get stronger and push the price up. The first candlestick should be big and bearish. The following candlestick should be bullish and open below or equal to the prior low. The closing price of this candlestick should be below the previous opening. Both real bodies should be low enough. The pattern requires confirmation in the form of breaking out a significant level or a trend line.
Bullish harami
Main characteristics:
1. The number of candlesticks: 2;
2. Frequency: Often;
3. Color: The first candle is bearish, and the second is bullish;
4. Key features: The candles appear during the downtrend. The second candle should be contained within the first candle's real body.
The word “Harami” means pregnant in Japanese. This is not a coincidence: the pattern looks like a candlestick about to give birth! The first candlestick is long and bearish, while the second is small. Moreover, the second candle should be “inside” the first candle's body. The reversal signal is stronger when a candle after the pattern closes above the closing price of the second (the “baby”) candlestick.
Bullish harami cross
Main characteristics:
1. The number of candlesticks: 2;
2. Frequency: Rare;
3. Color: The first candle is bearish, and the second candle is doji;
4. Key features: The candles appear during the downtrend. The second candle should be a doji inside the first candle's real body.
This scenario resembles the bullish harami pattern, except the second candlestick is a doji. This variation typically indicates a stronger signal than the standard pattern.
Three inside up
Main characteristics:
1. The number of candlesticks: 3;
2. Frequency: Often;
3. Color: The first candle is bearish, the second candle is bullish, and the third candle is bullish;
4. Key features: An extension of the bullish harami pattern.
The extended bullish harami pattern, identified by Gregory Morris, involves a third candle that confirms a trend reversal following a bullish harami pattern. This third candle closes above the price of the second candle. It's possible for the second candle's opening price to match the first candle's closing price. Similarly, the second candle's closing price might align with the first candle's opening price, but these should not happen simultaneously. In this pattern, the shadows are considered irrelevant.
Tweezers Bottom
Main characteristics:
1. The number of candlesticks: 2, but you can add more;
2. Frequency: Rare;
3. Color: Any;
4. Key features: The candles can have any form except for the four-price doji. The low price should be equal to the previous low.
Although the pattern rarely appears on the chart, it tends to be reliable. When you trade this pattern, the key to success is to find candlesticks with equal lows that appear at the end of a downtrend.
Bullish engulfing pattern
Main characteristics:
1. The number of candlesticks: 2;
2. Frequency: Often;
3. Color: The first candle is bearish, and the second candle is bullish;
4. Key features: The candles appear during the downtrend. The second candle should open below the low of the first candlestick low and close above its high.
A quite common bullish pattern that signals the reversal to the upside. This pattern produces a strong reversal signal as the bullish price action completely engulfs the bearish one. The bigger the difference in the size of the two candlesticks, the stronger the buy signal.
Three white soldiers
Main characteristics:
1. The number of candlesticks: 3;
2. Frequency: Rare;
3. Color: Bullish;
4. Key features: Series of 3 bullish candlesticks. The first one appears as a part of the downtrend. Each candle should open within the previous body, better above its middle. Each candle closes at a new high, near its maximum.
This is a rare pattern with a strong reversal signal. All three candlesticks should have big real bodies. After the first candlestick, the second opens within the body of the first one and closes above it. The third candlestick should open within the body of the second one and close above it. Phew, we want you to know these main bullish reversal patterns! There are more of them in reality, but they rarely appear on the charts. Now, let’s find out the main patterns that signal the reversal to the downside.
Bearish patterns
In this part of the lesson, we will have a closer look at the bearish reversal candlestick patterns. Besides the bullish reversal candlestick patterns, they signal the reversal to the downside.
Shooting star
Main characteristics:
1. The number of candlesticks: 1;
2. Frequency: High;
3. Color: It doesn’t matter, but bearish is better;
4. Key features: Short real body, an upper shadow that is at least two times longer than the body, small lower shadow.
This is one of the most noticeable reversal candlestick patterns during an uptrend. When you see it, don’t forget to make a wish for a sell signal! The long upper shadow shows us that the price is no longer accepted by market participants. The real body of this pattern should be small, as well as the lower shadow.
The reversal signal is considered stronger when:
The upper shadow is very long;
There is a gap between the previous candlestick and the shooting star;
The candlestick is bearish.
Evening star
Main characteristics:
1. The number of candlesticks: 3;
2. Frequency: Medium;
3. Color: The first candlestick is bullish, the color of the second one doesn’t matter, and the third candlestick is bearish;
4. Key features: the first candlestick is long, the second has a small real body, and the third is usually longer than the first. There is a gap up between the first and the second candlesticks. The third candlestick fills in the bullish gap.
This looks like a reversal to the downside, even visually!
Exactly. The more often you look through the chats, the easier it will be for you to spot reversal patterns and act on them.
Evening doji star
Main characteristics:
1. The number of candlesticks: 3;
2. Frequency: Rare;
3. Color: The first candlestick is bullish, the second candle is doji, and the third is bearish;
4. Key features: The first and the third candles are long, and the second is a doji.
This is the same pattern as the evening star, but the second candle should be doji. Although it rarely occurs, the signal given by this pattern is strong, especially if the gaps are formed between the candles.
Hanging man
Main characteristics:
1. The number of candlesticks: 1;
2. Frequency: High;
3. Color: It doesn’t matter;
4. Key features: The candle has a small real body and a long lower shadow.

Is it a hammer? No, it’s a hanging man! Apart from the hammer pattern, this one appears at the end of the uptrend. It can signal an end of the bullish trend, a top, or a resistance level. The candle has a long lower shadow, which should be at least twice the length of the real body. It may be any color, though if it’s bearish, the signal is stronger.
The pattern is confirmed when a bearish candlestick closes below the opening of the candlestick on the left side of the pattern.
Dark cloud cover
Main characteristics:
1. The number of candlesticks: 2;
2. Frequency: Medium;
3. Color: The first candlestick is bullish, and the second candlestick is bearish;
4. Key features: The first candlestick is long; the second should open above the first one and close below 50% of the first candlestick’s body.

This is the bearish brother of the piercing line pattern. The second bearish candlestick tests highs above the first but fails to keep the bullish momentum. As a result, the price reverses to the downside. Confirmation in the form of a support level breakout makes the signal stronger.
Bearish harami
Main characteristics:
1. The number of candlesticks: 2;
2. Frequency: Often;
3. Color: The first candle is bullish, and the second candle is bearish;
4. Key features: The candles appear during the uptrend. The second candle should be contained within the first candle's real body.

The “pregnant” candlestick appears at the end of an uptrend. That is, the body of the second candle is completely contained within the body of the first one and has the opposite color. The signal of this pattern is confirmed when the following candlestick is big and bearish.
Bearish harami cross
Main characteristics:
1. The number of candlesticks: 2;
2. Frequency: Rare;
3. Color: The first candle is bullish, and the second is doji;
4. Key features: The candles appear during the uptrend. The second candle should be a doji inside the first candle's real body.

This is a rare setup with a doji candlestick inside the real body of the first candlestick. The signal is strong if the next candle after the pattern gaps down.
Three inside down
Main characteristics:
1. The number of candlesticks: 3;
2. Frequency: Often;
3. Color: The first candle is bullish, the second is bearish, and the third is bearish.
4. Key features: an extension of the bearish harami pattern.

According to Gregory Morris, the third candlestick that closes below the second’s closing price is so important that it should be part of the bearish harami pattern. The shadows in this candlestick pattern don’t matter. The pattern is confirmed when the support or a trend line is broken.
Tweezers Top
Main characteristics:
1. The number of candlesticks: 2, but you can add more;
2. Frequency: Rare;
3. Color: Any;
4. Key features: The candles can have any form except for the four-price doji. The high of the second candle should be equal to the previous high.

A unique pattern that signals the reversal to the downside. The candlesticks may have any form except for the four-price doji.
Bearish Engulfing
Main characteristics:
1. The number of candlesticks: 2;
2. Frequency: Often;
3. Color: The first candle is bullish, and the second candle is bearish;
4. Key features: The candles appear during the uptrend. The second candle should open above the high of the first candlestick and close below its low.

You can meet this pattern on the chart very often. After the bullish candlestick, the second is bearish and opens above the first candlestick’s high. The signal is confirmed if it closes below the first candlestick’s low. This pattern produces a strong reversal signal as the bearish price action completely engulfs the bullish one. The bigger the difference in the size of the two candlesticks, the stronger the sell signal.
Three black crows
Main characteristics:
1. The number of candlesticks: 3;
2. Frequency: Rare;
3. Color: Bearish;
4. Key features: Series of three bearish candlesticks. Each candle opens within the body of the previous one, better below its middle. Each candle closes at a new low, near its minimum.

The three bearish candlesticks indicate the beginning of a new trend. This pattern is quite reliable. However, a confirmation is still suggested. It may look like a bearish candlestick with a lower close or a gap down.
We have introduced the primary types of reversal candlestick patterns. It is highly recommended to save this lesson or take notes for improved comprehension and accelerated learning. Now, let's summarize our learnings!
Reversal candlestick patterns represent a group of candlestick patterns that indicates that a trend will change direction or make a deep correction;
Bullish and bearish reversal candlestick patterns exist in trading. Bullish patterns suggest a potential upward reversal, whereas bearish patterns indicate a possible downward shift.
Reversal candlestick patterns indicate that a reversal is possible but not guaranteed. For a reversal to occur, there must be a strong and steep preceding trend.
Numerous candlestick patterns exist, with the most well-known being stars, harami, engulfing patterns, the hammer, and the hanging man. Most require confirmation through a significant level breakout.
The signal strength of a pattern is enhanced if it includes a cross, known as a doji.
In our upcoming lesson, we will examine the patterns that indicate the strength of a trend, known as continuation patterns.
Japanese candlesticks: core basics
They could be called hotdogs if they were invented in the USA. However, around five centuries ago, Japanese people came up with a more elegant name. Now, traders all over the world use Japanese candlesticks for market analysis.

The unique market signals and visual convenience of Japanese candlesticks are the main reasons why traders prefer them for market analysis. If you want to learn the secrets behind the candlestick chart and predict signs of reversal by finding candlestick patterns, this course is for you.
By successfully passing this course, you will:
Master the main candlestick types;
Spot candlestick patterns and interpret their meaning;
Learn effective trading strategies with candlestick patterns.
Make your first steps in understanding the skills and knowledge invented by Japanese sensei!
What are candlesticks?
Japanese candlesticks are the core elements of the candlestick chart. A single candlestick shows the dynamics of a price during a particular period.
Open the weekly timeframe. One candlestick there will show a 1-week change in the price. So, this is how the market behaved from Monday to Friday. Now go to the 5-minute chart. Do you see candlesticks swinging up and down? On this chart, one candlestick demonstrates a change in the price within 5 minutes.
A single candlestick consists of three main parts.

A real body – the thick part of a candlestick. This is an area between the open and the close prices;
An upper shadow (wick, tail) – the vertical line above the real body. It shows the high of the session;
A lower shadow (wick, tail) – the vertical line below the real body. It shows the low of the session.
If the prices rose during the period, the candle is usually painted in white or green. In this case, the opening price is at the bottom of the body, and the closing price is at its top. This candlestick is called bullish.
If the prices fell during the period, the candle is usually painted in black or red. In this case, the opening price is at the top of the body, and the closing price is at its bottom. This type of candlestick is named bearish.
On the Internet, I see many candlestick charts. Strangely enough, they are all colored differently. Sometimes, I stumble across black and white candlesticks, in other times – green and red ones. Do the colors of the candlesticks really matter?
To tell the truth, it does not matter how you decide to design your charts. However, you should define two colors for bullish and bearish candlesticks. In FBS, we use green for bullish candlesticks and red for bearish ones.
Candlestick chart
Although the candlestick chart and its American brother – bar chart – have similarities as they use the same data, they are different. Have a look at the picture below, where we placed a bar chart (on the left) and a candlestick chart (on the right).

A сandlestick chart is more informative than a bar chart. See for yourself: real bodies of candlesticks give us a visual representation of the market situation. If the body of a candlestick is long, it shows a very active session. On the contrary, candlesticks with small bodies signal a calm market. We pay a lot of attention to the form of a candlestick’s body and to the size of its shadows, as they may reveal all the secrets hidden behind the market’s picture.
I still think there is not so much difference between the bar chart and the candlestick chart. Can you give a clear example of the candlestick chart’s superiority over the bar one?
Let’s have a look at the weekly chart of EURUSD. We highlighted a period of horizontal consolidation in a rectangle. With a bar chart, it’s almost impossible to see what candlesticks this rectangle consists of. On the contrary, the candlestick chart gives us a clear picture. We can see that there are more green candlesticks than red ones inside the pattern. With such a quantity of candlesticks inside the pattern, we get additional confirmation of further upside momentum.

In the next part of this lesson, we are going to observe the main types of candlesticks and see what they can tell us about the price.
Types of candlesticks
As mentioned above, the shapes and sizes of candlesticks can tell a lot about the nature of price action. Traders and investors define several main types of candlesticks that have their unique features. Don’t be afraid; they are really easy to spot!
Shaven head and shaven bottom

If a candlestick has no upper tail, traders call it a “shaven head” candlestick. It tends to show the bearish dynamics in the market.
On the contrary, a candlestick without a lower shadow is known as a “shaven bottom.” This type of candlestick demonstrates that buyers press on.
You can see examples of these patterns in the picture below.
Spinning tops

A candlestick with a small real body and long upper and lower shadows is called a “spinning top.” Spinning tops are the signs of the market’s indecision: both bulls and bears were active, but neither took over the market.
After a long advance or a long bullish candlestick, a spinning top indicates weakness among buyers and a potential change or interruption in a trend.
After a long decline or a long bearish candlestick, a spinning top indicates weakness among sellers and a potential change or interruption in a trend.
On the H4 chart of IBM, several spinning tops indicate the change in the market’s direction.
Marubozu

Now imagine that a candlestick has a very thick body and no upper or lower shadows. This candlestick has a very Japanese name – Marubozu.
A bullish Marubozu is formed when the opening price equals the minimum price, and the closing price equals the maximum. It shows that buyers controlled price action during the entire period.
A bearish Marubozu is formed when the opening price equals the maximum price, and the closing equals the minimum price. It shows that sellers controlled price action.
On the M30 chart of the WPP stock, two Marubozu candlesticks demonstrated the strength of the bullish trend.
Candlestick with short shadows
One of the most common candlestick types is a candlestick with short shadows. Candlesticks with short shadows indicate that most of the trading action was confined near the open and close prices.

On the daily chart of EURUSD below, candlesticks with short shadows formed an uptrend.
Candlestick with a long upper shadow

Candlesticks with a long upper shadow and short lower shadow indicate that buyers dominated during the session, but sellers managed to pull prices down from their highs by the end of the period. Such a candlestick is usually followed by a decline in price.
Candlestick with a long lower shadow
Vice versa, a candlestick with a long lower shadow shows that sellers dominated during the session, but the price managed to close higher. The price often rises after candlesticks like this.
On the daily chart of EURUSD below, we can see candlesticks with long lower and upper shadows.
Doji

A candlestick with an ultra-small real body (open and close prices are almost equal) is called a “doji.” If this candlestick is formed, neither bulls nor bears dominate the market. The market is uncertain. The doji candlestick is a tricky one. On its own, it does not tell us much. However, it can become a significant indicator of reversal if certain conditions in the market are implemented.
Oh, this is cool! Tell me, please, when does it mean reversal?
In general, a doji candlestick becomes a reversal candlestick when the following conditions are met:
A doji is formed after a series of bullish candles with long bodies (during an uptrend) or after a series of bearish candles with long bodies (during a downtrend). Usually, it signals a trend’s weakness;
The candlesticks after the doji confirm the reversal (see the lesson “Reversal candlestick patterns”);
The market conditions are overbought or oversold.

For example, on the M30 chart of AUDJPY, a doji candlestick was formed and indicated a bearish reversal.
In the classic literature dedicated to candlesticks, you can find four types of doji. Let’s look at them in the picture below.
Long-legged doji has long upper and lower shadows that are almost equal in length and reflect a great amount of indecision in the market.
Dragonfly doji is a significant bullish reversal pattern that mainly occurs at the end of downtrends.
Gravestone doji is a significant bearish reversal pattern that mainly occurs at the top of uptrends.
Four-price doji is very rare and represents complete and total uncertainty by traders concerning the market direction.
In the first Western study dedicated to Japanese candlesticks, Steve Nison defines the Northern doji and the Southern doji. The former describes the doji during the downtrend, and the latter – the doji during the uptrend.
The doji candlesticks can be even more relevant if they are part of candlestick patterns. Japanese traders defined many different types of candlestick patterns that helped them predict further market movements.
Now you know the main types of candlesticks that occur in the market. Let’s revise your knowledge.

Candlesticks are the elements of the candlestick chart. A candlestick consists of upper and lower shadows and a real body;
Candlesticks help to predict the current strength of a trend, may serve as support or resistance, and give signals of a potential change of the market’s direction;
There are various types of candlesticks: shaven head and shaven bottom, spinning tops, candlesticks with long and short shadows, Marubozu, and doji;
The doji candlesticks signal indecision in the market. They are often included in the candlestick patterns that signal a potential change in a trend.